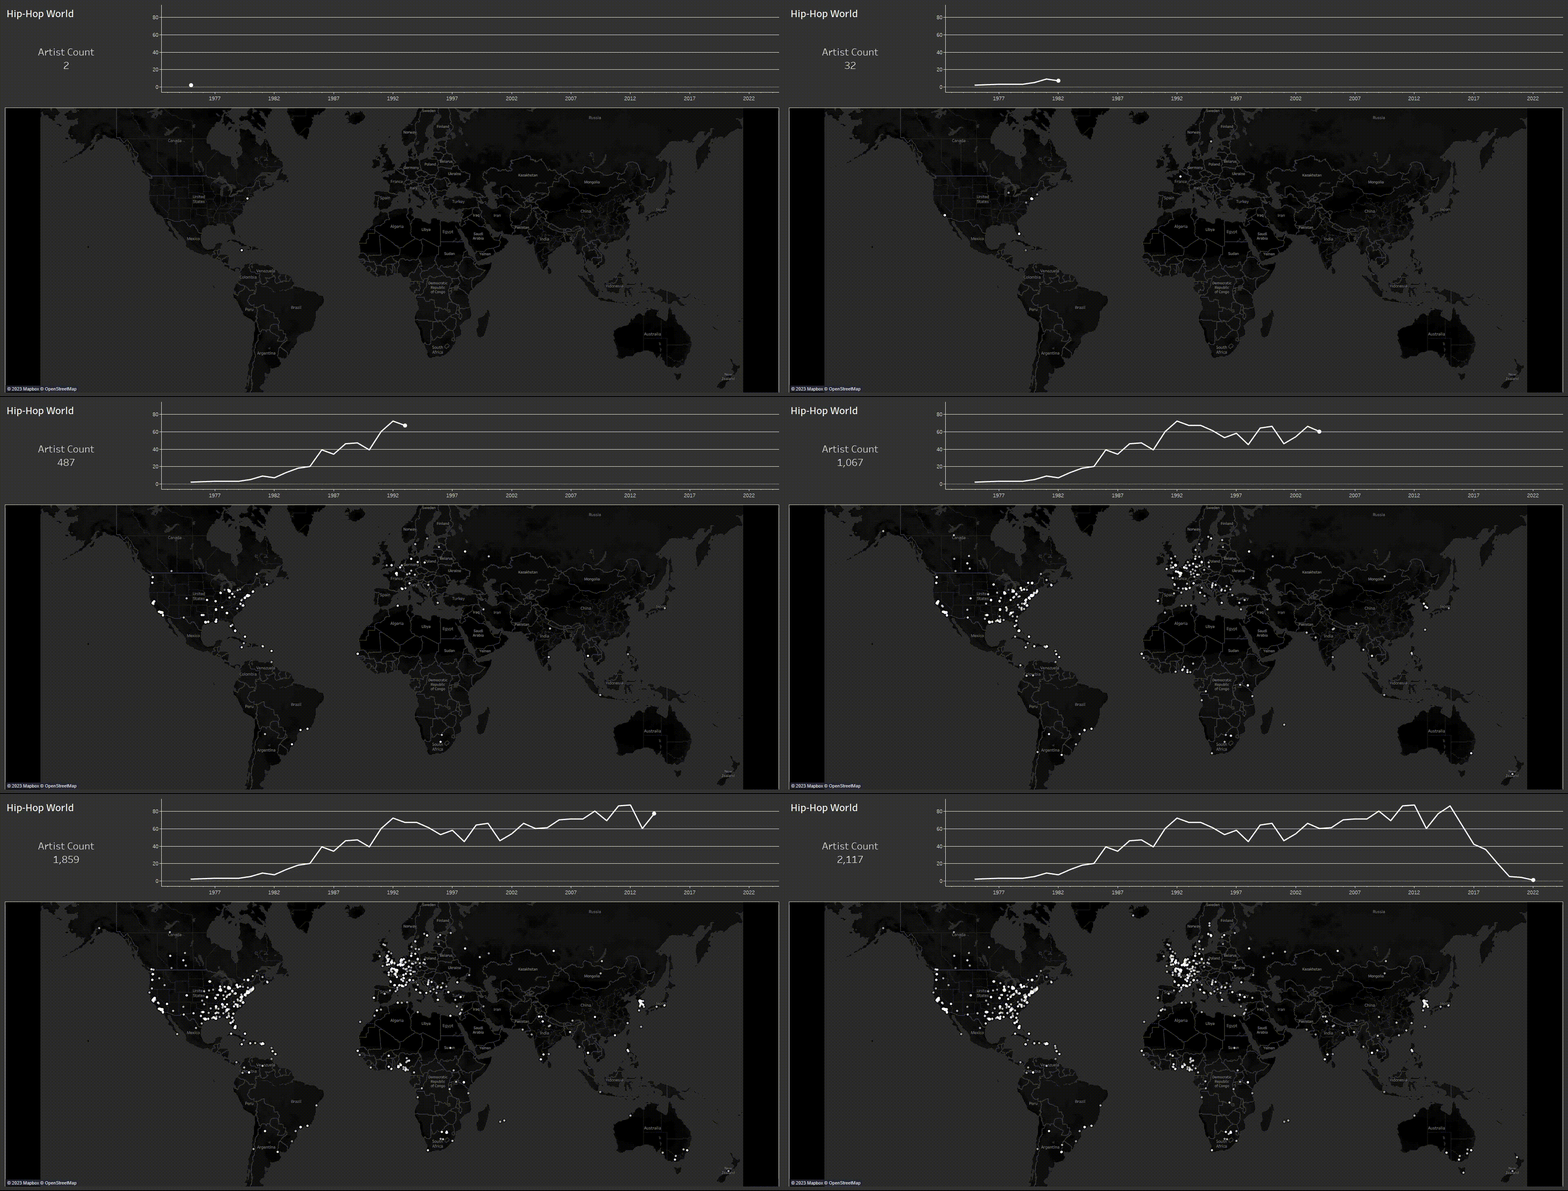
Hip-Hop World Visualization
Github Tableau
This visualization shows when hip-hop artists from all around the world began their careers. The tools used for this project are Python and Tableau.
*On Tableau, the animation for this visual would not work due to the large data set. This is why I'm showing a recording of the animation rather than embedding the workbook.
Cleaning
The first step was to explore and clean the Rap World Map dataset. The only data that's really needed is the name, location, and when the artists started.
Web Scraping
Next was scraping Wikipedia for more artists. I pulled a list of hip-hop musicians and filtered out the ones that are already in the Rap World dataset. Then we could loop through each artist to get the data needed.
Now that the terms are defined we can start the scraping process. This code will create a URL with the artists name(term) attached to the end. Then it will pull the data from the infobox on that page.
This is where the first issue began. Some artists have names that resemble other things. For example, there is a rapper named Apathy. However, when the URL is created, this would result in a page about apathy or being apathetic. To fix this, the string '_(rapper)' had to be affixed to the term.
Now these results can be exported to a spreadsheet.
This data was uploaded to Tableau and the animation was created using the Pages feature.